Chapter 1 – INTRODUCTION
The Problems:
1. Biology as a science: Not being derived mathematically from rules and first principles.
2. The biology literature: Catalogues parts and but not complexities.
3. Meta-analyses: Most published results are incorrect statistically (Ioannides 2005).
4. Detecting differences – not changes: Changes assumed – not demonstrated.
5. “Cell changes”: Produced by two competing players – cells and methods.
6. Reproducibility: Not included in experimental models.
7. Reductionism: Treats a cell change as a simplicity (considers parts but not connections).
8. Publications are incomplete: Lack key information, include experimental errors, usually cannot be reproduced, and lack a plausible definition for a cell change.
9. The basic mechanism of a cell change remains undefined: Only small fragments of cell changes are reported.
Solutions:
1. Update the biology literature: Upgrade simple parts to complexities (correct, expand, connect).
2. Copy the way cells change: Use reproducibility to verify the changes.
3. Forward and reverse engineer cell changes: Detect rules and principles empirically.
4. Interpret cell changes: Report the same data in adaptability (disorder) and rules (order) layers.
5. Model the way cells change: Track changing relationships of structure to function over time.
6. Calculate relationships of structure to function: Relate biochemistry to morphology.
7. Separate the changes produced by cells and methods: Update published data.
8. Demonstrate reproducibility: Duplicate results within and across studies empirically.
9. Update simple data to complex: Connect pairs of parts to create complexities.
10. Most publications lack sufficient data to detect or reproduce a change: Use mashups.
11. Model the complexity of a cell change: Plot the transition from one phenotype to another.
12. Pack and unpack the complexity of a change: Forward and reverse engineer cell phenotypes.
13. Treat the literature as a renewable resource: Encourage authors to publish raw data.
14. Test the biochemical homogeneity postulates: Calculate structural and functional recoveries.
Chapter 2 – EXPERIMENTAL METHODS BECOME VARIABLES
Problems:
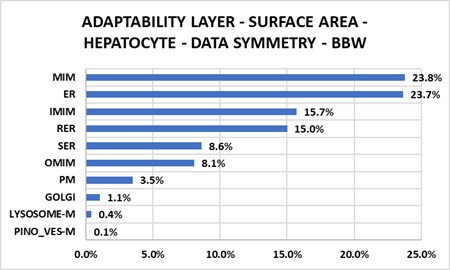
- Adaptability layer (disorder): Fifty-eight examples of the same part taken from different studies display different values (Figure 2.1). Rules layer (order): However, all fifty-eight parts displayed the same left to right volume ratio rule (4:5) (Figure 2.2 from Bolender, 2019). Paradox: The same data can be different and the same at the same time.
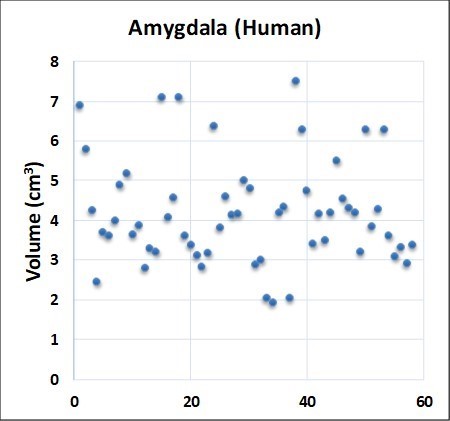
Figure 2.1 Adaptability layer describes disorder.
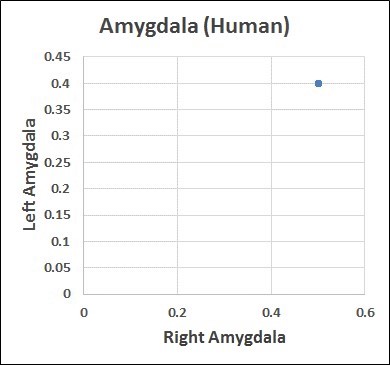
Figure 2.2 Rules layer converts disorder to order.
- Concentration data: Both numerator and denominator behave as variables.
- Data references: Different references produce different results.
- Mean values: Represent black boxes containing data corrupted by the methods.
- Adaptability layer: Data points appear chaotic as single, isolated units of information.
Chapter 3 – DATA REFERENCES
Problems:
1. Biological data references: Routinely treated as dilute solutions.
2. Cell changes: When measuring changes, both the data and the data references change.
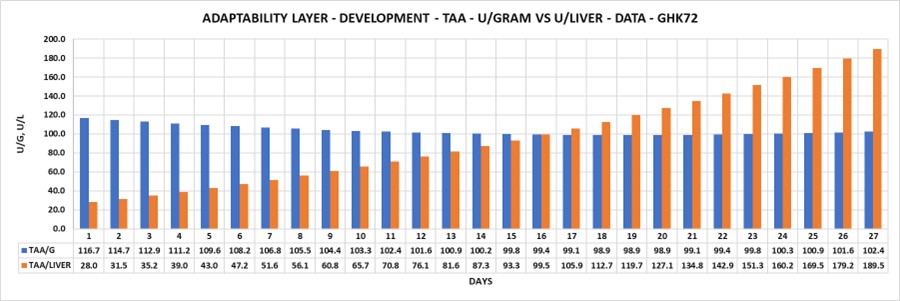
3. Data References: When cells change, references routinely become variables when the experimental errors change (Figure 3.1).
Chapter 4 – THEORIES AS STEPPINGSTONES
Problems:
1. Reductionism reduces a cellular change to a significant difference between two isolated data points: Simplified data create problems – no complexity, no verification (reproducibility).
2. Complexity theory copies the cell’s rules for change: This requires access to raw data missing from most publications.
3. Cell changes require complex data types (two parts + one connection = a complexity): When each of the two parts, which may or may not define a relationship of structure to function, are expressed as polynomial equations, each parts in every data pair can change differently (↑, ↔, ↓). By knowing the value of one part, however, one can automatically know the value of the other. For cells, this curious property of the data pairs (classical entanglement) was included in the experimental models for cell change.
4. A biological change can be defined statistically (not updated) and biologically (updated): We prefer to interpret a change as a simple difference between simple parts (Figure 4.1). In contrast, cells use complex parts to define a change as a complex problem-solving event (Figure 4.2).
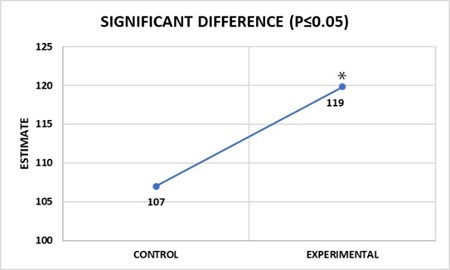
Parts + Connections + Rules + Reproducibility.
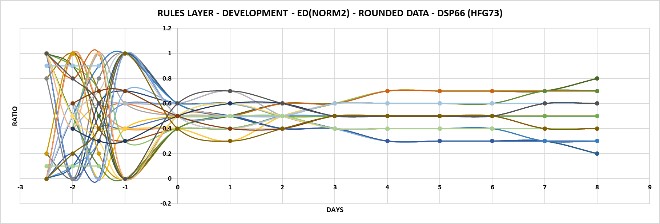
Figure 4.1 Figure 4.2 The cell’s view of change (complexity → simplicity). Notice that a temporary solution (no change) exists at developmental days four, five, and six.
Chapter 5 – DEVELOPMENTAL PHENOTYPE
Problems:
1. Aggregating published data: Reconnecting published data with different experimental errors and incompatible data references became problematic.
2. Detecting reproducibility: Duplicating cell changes across publications with incompatible references and missing data created challenges.
3. Identifying unique identifiers of change: New strategies for detecting reproducible changes, patterns, and recipes were needed.
4. Understanding the basics of a cell change: As complexities, cells must alter specific relationships of structure to function to produce unique and viable outcomes.
5. Missing data: Mashups became necessary when publications lacked the data needed to detect cell changes.
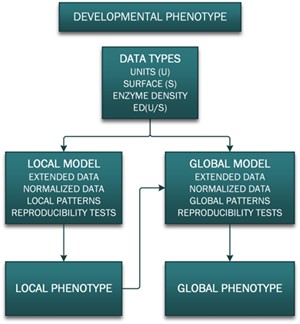
6. To detect cell changes, specific data became essential: Methods were needed to correct, expand, borrow, normalize, reproduce, and generate phenotypes (Figure 5.1).
Chapter 6 – INDUCED PHENOTYPES
Problems:
1. Interpreting experimental results required two sets of changes: Per cells and per organs.
2. Theoretically, complexity allows different solutions to the same problem: Cells can triage responses differently.
3. Publications routinely use different references for morphological and biochemical data: To change, cells alter relationships of structure to function. Figure 6.1 illustrates the progress of the solution to phenobarbital problem, which may have occurred on day five. The percentages indicate the relative amount of change attributed to three enzymes all related to the same amount of ER surface area. enzyme activity

Chapter 7 – MISCELLANEOUS PHENOTYPES
Problems:
1. Biology defines order mathematically: Cells use the ratios of parts to create and duplicate complexity.
2. Detecting cell changes requires hypothesis testing: The postulates of biochemical homogeneity can be put to the test by calculating morphological and biochemical recoveries.
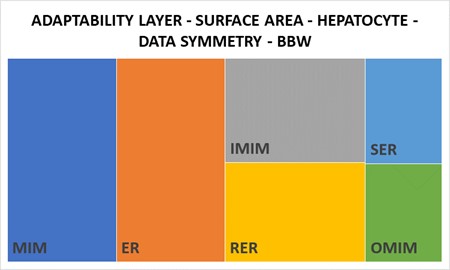
3. A cell phenotype (control) displays distinct structural patterns often defined by one-to-one ratios (Figure 7.1).
Chapter 8 – LIVER LOBULE
Problems:
- Hepatocytes display differences within the liver lobule: Both morphological and biochemical.
- Subpopulations of hepatocytes change differently: Models and rule-based approaches for detecting such changes become essential.
- Assumptions introduce uncertainties: Biopsies, for example, assume representative sampling.
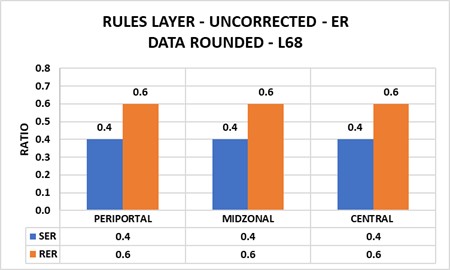
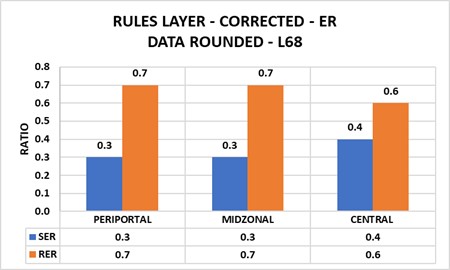
- Uncorrected data lead to incorrect results: Although stereological estimates assume two dimensional sections, electron micrographs collect data from three-dimensional sections. Corrections become necessary (Figure 8.1).
Chapter 9 – PUBLISHED DATA → GLOBAL PHENOTYPES
Problems:
- The biology literature is organized by parts: Not by rules defining phenotypes.
- Publications largely contain standalone data: Quantitative connections do not exist within and across publications.
- Publications report isolated fragments of changes: Missing information is widespread.
- Simplifying cell parts by removing critical information forfeits critical information: Assumptions replace the missing information.
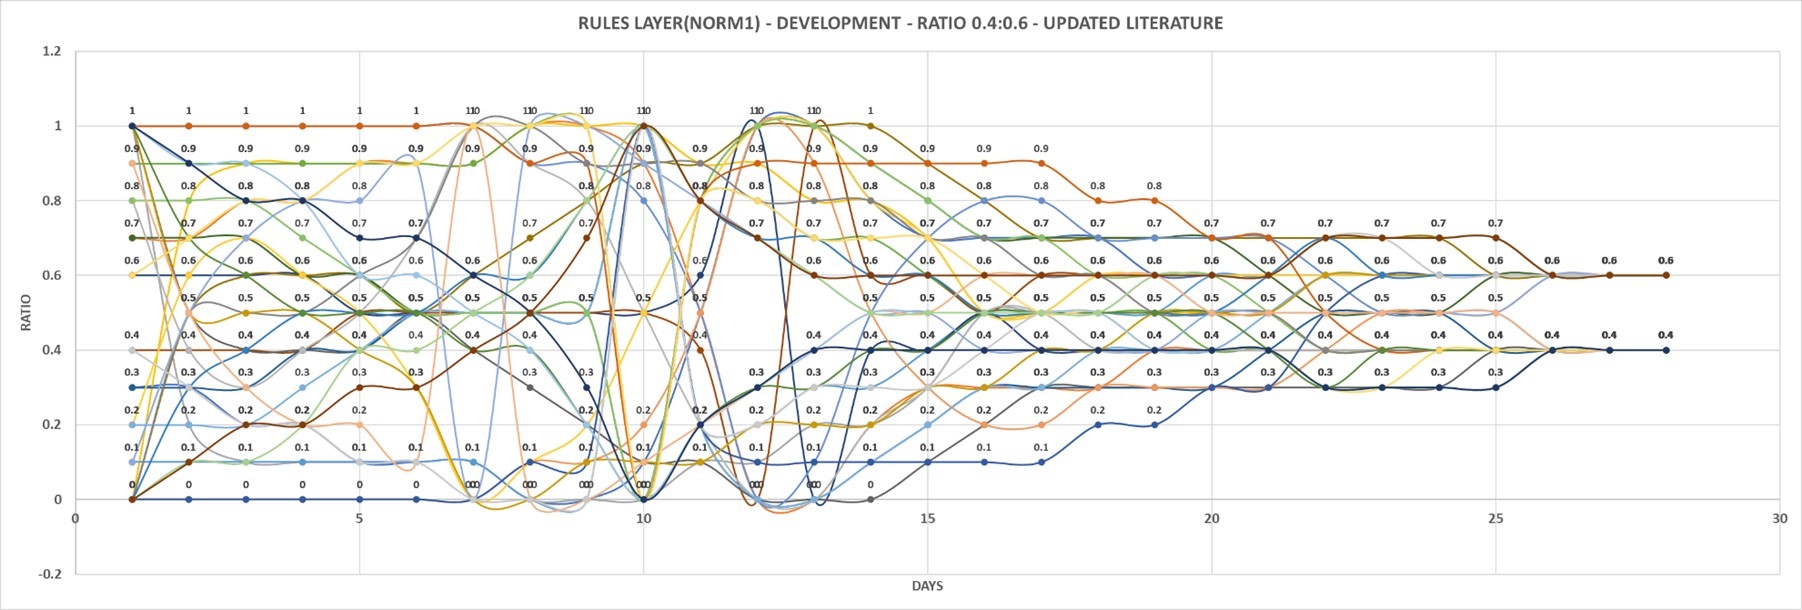
The basics of biology derive from complexity: However, the biology literature prefers the simplicity of reductionism. For example, Figure 9.1 shows the solution of a subgroup of changing parts extracted from the larger cell phenotype by reverse engineering. It posits the principle of multiple solutions for change.
Chapter 10 – CALCULATIONS – UPDATING PUBLICATIONS
Problems:
- Published data detect differences but not changes: Simple data cannot detect complex events.
- Connecting published data becomes problematic: Datasets are incomplete and incompatible.
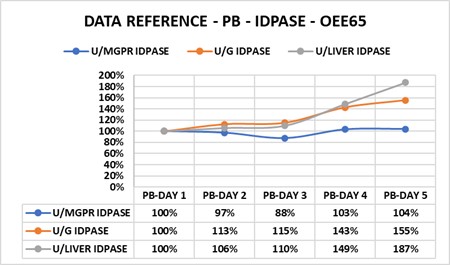
- As a largely methods-driven science, the underlying rules of biology are widely ignored. Figure 10.1 illustrates changes in the same enzyme activity related to two different references. The reference least likely to be correct is one most often published.
